February 2025
Inside the Newsletter:
BMPs Safer Chemical Alternatives | Chloride Sources & Reductions | Industrial Wastewater | Food Waste | Events | Funding Opportunities
Best Practices for Finding Safer Chemical Alternatives
Chemicals are all around us. While some— such as cellulose, DNA, and even water— are necessary to life and the natural world, other chemicals can be harmful to human and environmental health. Many chemicals that serve as active ingredients in flame retardants, paints or dyes, water and stain repellents, cleaners and disinfectants, degreasers, adhesives, and other essential products must be used prudently to protect employee health and/or prevent air or water pollution. Certain chemicals— such as volatile organic compounds (VOCs) and starting in 2026, PFAS—are closely regulated by the State of Minnesota due to their hazards. Their use can result in regulatory fees or even fines if mishandled.
Fortunately, MnTAP has served as an effective partner for many businesses and industries that are looking for safer, cost-effective alternatives to harmful chemicals, such as trichloroethylene (TCE). Through site visits, consultations, and collecting samples, MnTAP staff and/or interns can propose alternatives that meet businesses’ needs; give guidance on how to adopt alternatives with their current processes; and identify resources (e.g., loans and grants) to help with upfront implementation costs. All MnTAP staff services are confidential, at no cost, and non-regulatory. When more in-depth assistance is needed, the MnTAP intern program provides extended, hands-on assistance for a nominal cost-share. Learn more on how to apply for the summer 2025 intern program.
For businesses interested in general tips on how to better protect their employees, communities, and the environment from hazardous chemicals, here is a list of best practices:
- Carefully read labels and safety data sheets (SDS) for product guidance. Product labels provide a list of chemical ingredients; health and safety warnings; and directions for use, dilution, and storage. For more in-depth information, check the SDS for toxicity information, environmental effects, personal protective equipment (PPE) requirements, and emergency procedures for a spill or a fire.
- Translate product safety information to help all employees understand. Since labels and SDSs might only be in English, this information may not be easily accessible to staff members whose primary language is not English. Businesses have met this challenge by translating this information and relaying it through multilingual training sessions, creating posters in different languages, and ensuring supervisors know this information and can consistently guide their staff on best practices.
- Watch out for greenwashing. Products advertised as “green” are not always safer. Purchase safer products based on reputable certifications, such as the EPA’s Safer Choice Label; Green Seal; or UL Solution’s EcoLogo. The Toxic Use Reduction Institute’s (TURI) Cleaner Solutions Database is also a reliable resource to identify safer cleaning products.
- Avoid common hazardous ingredients. While every application has its own specific requirements, some chemicals are best avoided in most situations. These include chlorinated or fluorinated solvents; phthalates; 2-butoxyethanol; nonylphenol ethoxylate (NPE); bisphenol A (BPA); 1-Bromopropane (i.e., N-propyl bromide or nPB); trans-1; 2-Dichloroethylene (tDCE); and D-limonene. Other lists to check for chemicals to avoid include hazardous air pollutants (HAPs); volatile organic compounds (VOCs); and the Minnesota Department of Health’s list of chemicals of high concern.
- Avoid added fragrances. Even fragrances touted as natural, such as essential oils of citrus or pine, can react and produce harmful indoor pollutants that can cause asthma attacks; headaches; or irritation to throat, nose, and eyes.
- Prevent overuse of chemicals with proper dilution. Avoid using more product than needed by following the dilution instructions on the label. Automatic dilution systems can also reduce the likelihood of human mistakes when it comes to measuring the correct chemical-per-water ratio.
- Purchase high volume products in bulk. Many industrial products are available for purchase in bulk packaging (e.g., pails or drums) instead of containers (e.g., spray bottles or aerosol cans) aimed at consumers. Purchasing in bulk can decrease packaging, lower costs, and eliminate the propellants used in aerosol products that often contain VOCs. Make sure to follow all material storage and hazardous waste regulations, and if applicable, ensure all material is used before its expiration date. Networking with other companies to share excess product can make it easier to use up products before their printed expiration date.
- Consider switching to aqueous and semi-aqueous cleaners and degreasers. MnTAP staff can help businesses investigate cleaning or degreasing options that are safer for human exposure and the environment, offer comparable capabilities, and meet businesses’ needs.
- Take steps to reduce harmful chemicals even if it is impossible to eliminate their use for now. It can be easy to feel paralyzed if there is no way to completely stop using a harmful chemical because it performs a vital function or is required by customer specifications. There is still good in reducing the overall amount of this harmful chemical by replacing them with alternatives wherever possible and revisiting annually to see if replacing this chemical becomes viable. It is valuable to strive to change even if flawless and perfect execution is not on the table right now.
In conclusion, chemicals can be both useful while presenting significant challenges to employees’ health, surrounding communities, environment and ecosystems, and regulatory compliance and fines. However, there is a lot of information and resources available, and MnTAP is here to help businesses take meaningful action in adopting safer alternatives while remaining economically viable and improving our environment.
Contact:
Jane Paulson – MnTAP Senior Engineer
janep2@umn.edu
Industrial Chloride Sources and Reduction
 Rising chloride levels are impairing water bodies in Minnesota. Last month, MnTAP outlined ways to reduce chloride pollution from deicing. Deicing is a big source of chloride, but water softening, household products, commercial products, and industrial processes also contribute. Wastewater treatment plants (WWTPs) do not remove chloride (it is expensive). A 2021 study by Overbo et al. estimated chloride sources to MN WWTPs. The top three chloride contributions to MN WWTPs are:
- Household water softening (49%)
- Industrial sources (21%)
- Commercial water softening (16%)
Chloride (typically as salt) has three main industrial uses: for water softening, as a process aid to facilitate making a product, or as an ingredient in a product. Industrial uses might include brining or curing in food processing, preservation in leather tanning, or as an additive for brewing. Chloride discharge can be reduced through water softener optimization, reducing soft water use, or process changes.
A 2021 MnTAP intern project focused on best management practices for industrial water softening. Four common recommendations MnTAP makes for water softener optimization are to:
- Track salt and water use: Knowing how much water is being softened and how much salt the softener is using are important to evaluate the softener, identify optimizations, and quantify savings.
- Reduce the salt dosage: The salt dosage is how many pounds of salt are used per cubic foot of resin during regeneration. Salt efficiency is how many grains of hardness are removed by a pound of salt. At lower salt dosages, salt efficiency is higher. Reducing the salt dosage reduces salt use, but sometimes, it can increase water use because annual regenerations increase. This can create a tradeoff between conserving salt and conserving water. It is important to evaluate how a change will affect salt use, water use, and costs overall. MnTAP typically recommends a minimum salt efficiency of 4,000 grains per pound and a minimum salt dosage of 5 pounds per cubic foot. Salt dosage information can be found in the softener manual or by contacting your softener technician.
- Adjust the hardness setting: The hardness setting on the softener doesn’t always match the incoming water hardness. Ensuring that the setting matches the actual incoming hardness is recommended. This will prevent the softener from regenerating too early or too late. The actual water hardness can be found by testing the water, checking with your water supplier, or looking online for water hardness in your area.
- Replace the resin bed: Over time, the resin bed degrades. One to three percent of resin is lost each year due to fouling, cracking, or leaving the softener. Typically, the resin bed is replaced every 10 years, so the softener continues operating with the same capacity.
Reducing soft water use decreases the number of times the softener regenerates, which reduces the amount of chloride going down the drain. Water reduction opportunities, such as low flow nozzles, more efficient equipment, or water reuse can be used to reduce soft water use.
Process changes can also reduce chloride discharge. A 2013 MnTAP intern project at Gedney Foods Company, a pickling plant, recommended reusing brine and reducing the salt level in storage tanks to reduce salt use and discharge. These two recommendations combined would save 460,500 pounds of salt, 543,200 gallons of water, and $46,500 annually.
Laura Sevcik – MnTAP Engineer
lsevcik@umn.edu
Industrial Wastewater Loading and High-Strength Waste Minimization
 Industrial users that require a discharge permit are often subject to limits or strength charges. Wastewater discharge limits are generally recorded by mass (i.e., pounds) or concentration (i.e., milligrams per liter or parts per million). Common parameters for such limits or charges include the following:
- Biological oxygen demand (BOD) or chemical oxygen demand (COD)
- Total suspended solids (TSS)
- Fats, oils, and grease (FOG)
- Nitrogen, phosphorus, and/or chloride
- Total daily and monthly flow
The mass of pollutants in a facility’s wastewater stream can be calculated as a function of both the concentration and the total flow for the monitoring period, as follows:

For example, a wastewater stream of 50,000 gallons per day with a BOD concentration of 1,400 milligrams per liter will discharge approximately 584 pounds per day of BOD.
There are two ways to lower the total mass of the chemical pollutants listed above in wastewater:
- Reducing pollutant concentration: Production records, safety data sheets, and local knowledge are useful in determining which materials in your facility contain high-strength pollutants. Once these sources have been identified, each step of the waste-generating process can be reviewed to minimize pollutant loss to drains, which will lower the concentration of contaminants in wastewater.
- Lowering wastewater volume. Reusing or recycling wastewater streams can reduce the total volume of wastewater discharged off site. Reviewing water-using processes for conservation opportunities can also reduce pollutant loading.
Decreasing the flow of uncontaminated water to wastewater drains can cause the pollutant concentrations to increase, so the above two strategies are often done in tandem to lower both the concentration and the flow.
Two recent MnTAP internships showcased several opportunities for reduction of pollutant loading in wastewater. In both cases, pollutant loading reduction was achieved by removing organic waste from wastewater, which contained high quantities of BOD and TSS:
- In 2023, MnTAP’s intern Sean Sticha worked at the Kemps dairy production facility in Minneapolis to determine how to minimize milk loss to wastewater drains. Sean identified the following opportunities:
- Implementing best practices for filler shutdown (29,000 gallons of milk)
- Installing conductivity probes prior to the filler bowl (94,000 gallons of milk)
- In 2024, the Lakeside Foods vegetable processing facility in Owatonna sought MnTAP’s assistance in increasing the yield from its bean processing operations while lowering BOD concentrations in wastewater. MnTAP intern Gannon Shilson identified the following opportunities:
- Replacing the hydrosieve used for bean separation with a model designed for the actual flow rate (1,270,000 gallons of water)
- Diverting bean waste from the hydrosieve for upcycling into animal feed (93,000 pounds of beans)
- Recirculating blancher discharge water (900,000 gallons of water)
Contact
Kevin Philpy – MnTAP Senior Engineer
philp029@umn.edu
Food Waste Impacts and EPA WARM Tool
 According to ReFED, a national organization dedicated to food waste minimization and diversion, 38% of food in the United States is unsold or uneaten, and most of this ends up as waste. There are multiple supply chain stages to get food from farm to table, including:
- Growing and harvesting
- Production
- Transport
- Retail
- Consumption
- End-of-life disposal
Waste can occur in any phase for various reasons. Efforts are underway nationally and internationally to reduce food loss and waste along the supply chain, and there are many different intervention points where loss and waste can be mitigated.
When food is wasted and ends up in a landfill, it starts to decompose under anaerobic conditions (i.e., without oxygen), and it emits methane as a byproduct. Methane is a potent greenhouse gas that contributes to global warming. Any effort to prevent food from becoming waste or diverting it to a pathway where it can be beneficially used or reused (e.g., donation, upcycling, compost, anaerobic digestion) reduces greenhouse gas emissions. According to Project Drawdown, a US-based nonprofit organization dedicated to providing science-based guidance for effective climate action globally, food waste has the greatest potential to reduce carbon dioxide equivalents (i.e., a common unit whereby all greenhouse gases, such as methane and nitrous oxide, are converted to a standard measure) in the atmosphere. The sizable amount of emissions is caused by the required resources to grow food as well as process, transport, package, and deliver food to a final destination. All these life cycle phases contribute to food waste’s high carbon impacts.
Food waste is just one emission source though. Many other material categories (e.g., plastics, metals, electronics, paper, cardboard, and glass) emit greenhouse gases as well. This is because the way these items are disposed of or recycled requires energy to process. Energy, in any kind, emits carbon dioxide equivalent.
The U.S. EPA houses many great resources to help people gain a better understanding on the impacts from their waste streams on the planet, and one of those resources is called the Waste Reduction Model (WARM). For simplicity’s sake, this resource allows users to model many different material categories— such as paper, a variety of plastics, food waste, metals, and mixed waste (i.e., variety of items across different categories)— and see how their management in a specific pathway (e.g., compost, landfill, and incineration) affects their carbon dioxide impact.
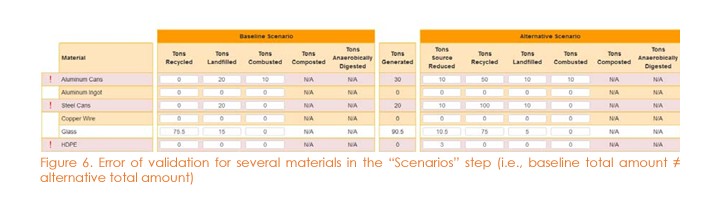
What’s nice about the tool is it allows users to investigate high-level carbon impacts for their materials management strategies. It allows them to input values and see how different volumes of materials impact emissions. It is meant as a high-level, first-pass tool to help organizations and businesses orient themselves in their sustainable materials management strategies and to better align certain pathways with the appropriate material category (e.g., compost for food scraps and organics, or recycling for plastics and paper). In other words, what are they currently doing with their materials, and how can they best reduce carbon emissions by changing the pathway those materials go to?
It also shows organizations what impact source reduction can have on their carbon emissions. Huge savings or reductions could be achieved by reducing a material stream going to a specific disposal method or by not generating any stream at all. This is because upstream impacts of producing any material tend to far outweigh the impact of that material being used by a customer or disposing of it after its useful life. For example, recycling a plastic bottle may be better than landfilling it, but why not eliminate the plastic bottle and go reusable in the first place? This is what is meant by source reduction, and something MnTAP helps businesses with every day. We want to prevent waste before it occurs, but when it does occur and is unavoidable, are we diverting it to the best possible pathway (e.g., recycling facility instead of a landfill or incinerator)?
Contact
Jon Schroeder – Sustainable Materials Management Specialist
jschro@umn.edu
Events
Smart Salting: Parking Lots and Sidewalks Certification Training
March 6, 8:00AM – 1:30PM
Virtual, No-Cost
This training is offered by MPCA to private winter maintenance companies and city, park, hospital, and school maintenance professionals. Participants earn a five-year certification for attending this training and passing the test. Learn more about this training and register for the March 6 training course.
Funding Opportunities
- Solid waste/wastewater PFAS treatment grant (MPCA): Deadline is 4 pm CT on February 14, 2025.
- PFAS source identification and reduction grant program (MPCA): Rolling deadline until 4 pm CT on April 2, 2025
- Locomotive Idle Reduction (MPCA): Rolling deadline until 4 pm CT on June 30, 2025.
- Environmental assistance loans for capital costs associated with environmental processes and technologies (MPCA & private financial institutions)
- Small business environmental improvement loans [0% interest for capital equipment purchases] (MPCA)
- Funding for brownfield investigation (MPCA): Ongoing and no deadline specified.