Energy Benchmarking – A Tool for Wastewater Treatment Plant Efficiency
 Energy is a significant part of plant operating cost. Estimates suggest energy accounts for 25-40 percent of the operating budgets of most wastewater utilities1 , and energy has the greatest potential for reduction. Energy use at wastewater treatment plants varies considerably even accounting for plant size difference..
The Value of Benchmarking
Energy benchmarking is a way to compare operations internally and externally. There are a number of different ways to benchmark energy performance, but using appropriate benchmarks allows judgements on whether significant opportunities to reduce energy operating expenses exist and the rough dollar value of potential improvements. In addition, advanced process benchmarking can help identify where in the plant the biggest opportunities are, and benchmarking over time can help confirm whether changes made are being effective. For more information on applying benchmarks, see the Using Benchmarks section below.
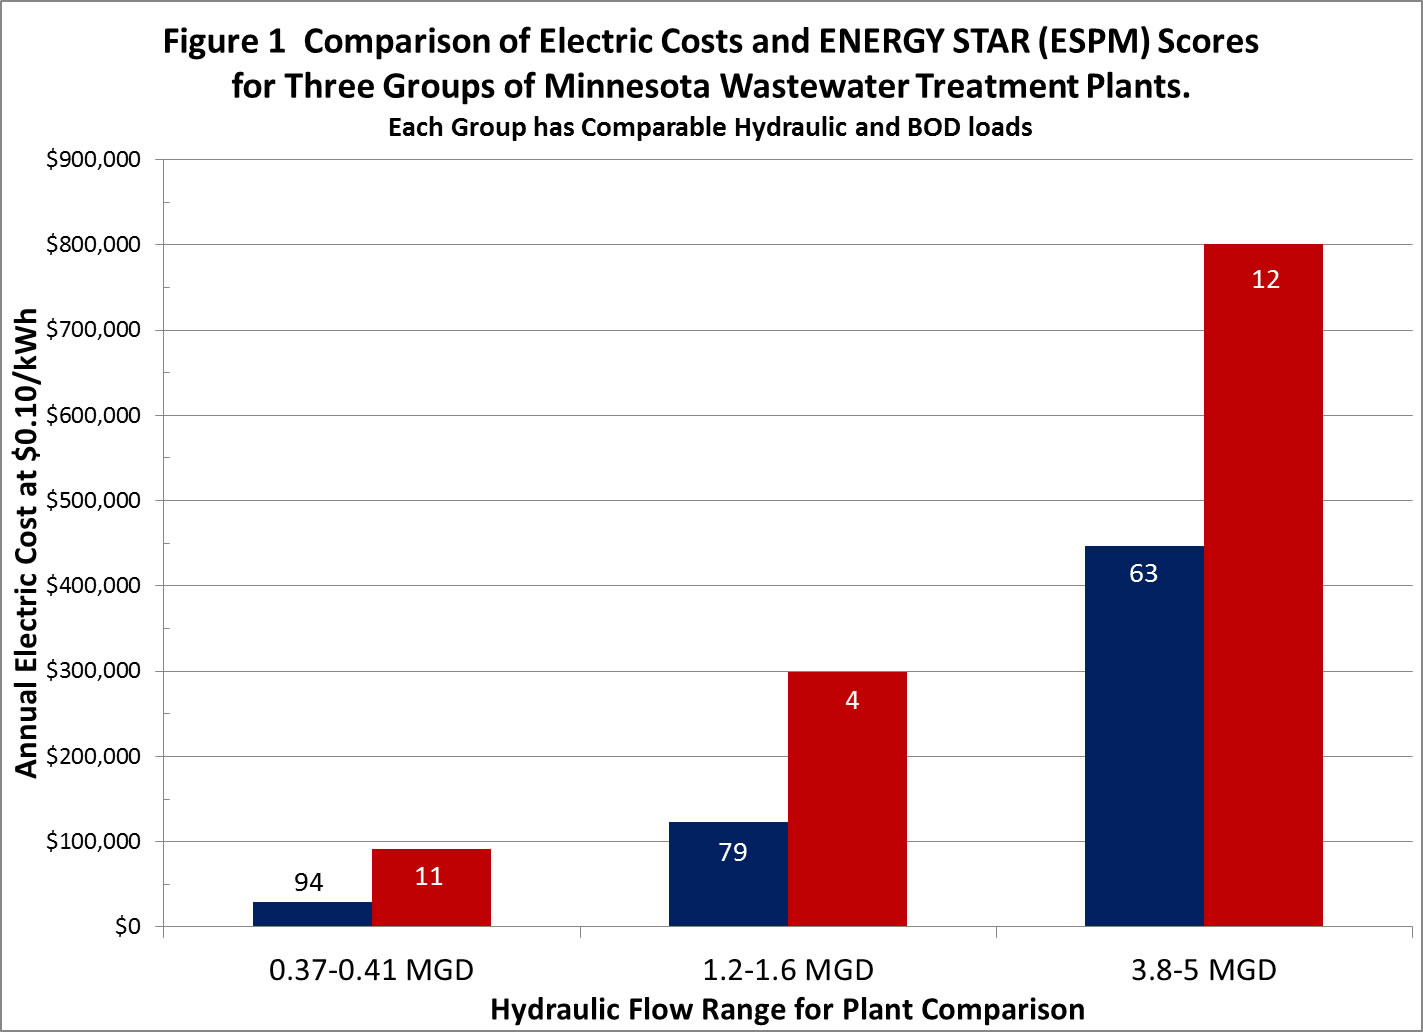 Having a high energy benchmark can cost a facility a lot of money. Looking at relatively similar plants it is common to find a two- to three-fold difference in energy benchmarks, meaning one plant might be using two times more energy with two times higher energy operating costs than another, more efficient plant. Using the most sophisticated benchmarking tool, Figure 1 shows EnergyStar® Portfolio Manager (ESPM) scores and the annual electric costs for six Minnesota wastewater plants, grouped into three ranges of plant size. Each group has a similar BOD load among the grouped plants. The EnergyStar® score is the percentile ranking of plant energy performance nationally. The blue bar in each group is the plant with the highest (most efficient) ESPM score, while the red bar represents the plant with the lowest ESPM score.
Energy efficiency improvements are likely to generate larger dollar savings for larger plants – for the 3.8-5 MGD group, there is a two-fold difference in electric costs and the least efficient plant could save $350,000 per year were they to raise their ESPM score to the 63rd percentile. However, among smaller plants there tends to be even greater variation on energy performance, so in the 0.37-0.41 MGD group there is a three-fold difference in energy consumption between the most and least efficient plants. A plant in this category that achieved an ESPM score of 94 could save $62,000 per year.
What is your energy benchmark score? How much can you save?
To start the process:
- Go to the EnergyStar® wastewater page and log in as a new user
- For information and assistance benchmarking your plant, Minnesota wastewater plants can contact:
- Jon Vanyo – Associate Engineer
612 – 624 – 4683 | jvanyo@umn.edu
- Jon Vanyo – Associate Engineer
Benchmarking Methods for Wastewater Plants
There are a number of benchmark methods, each with advantages and disadvantages:
- Flow
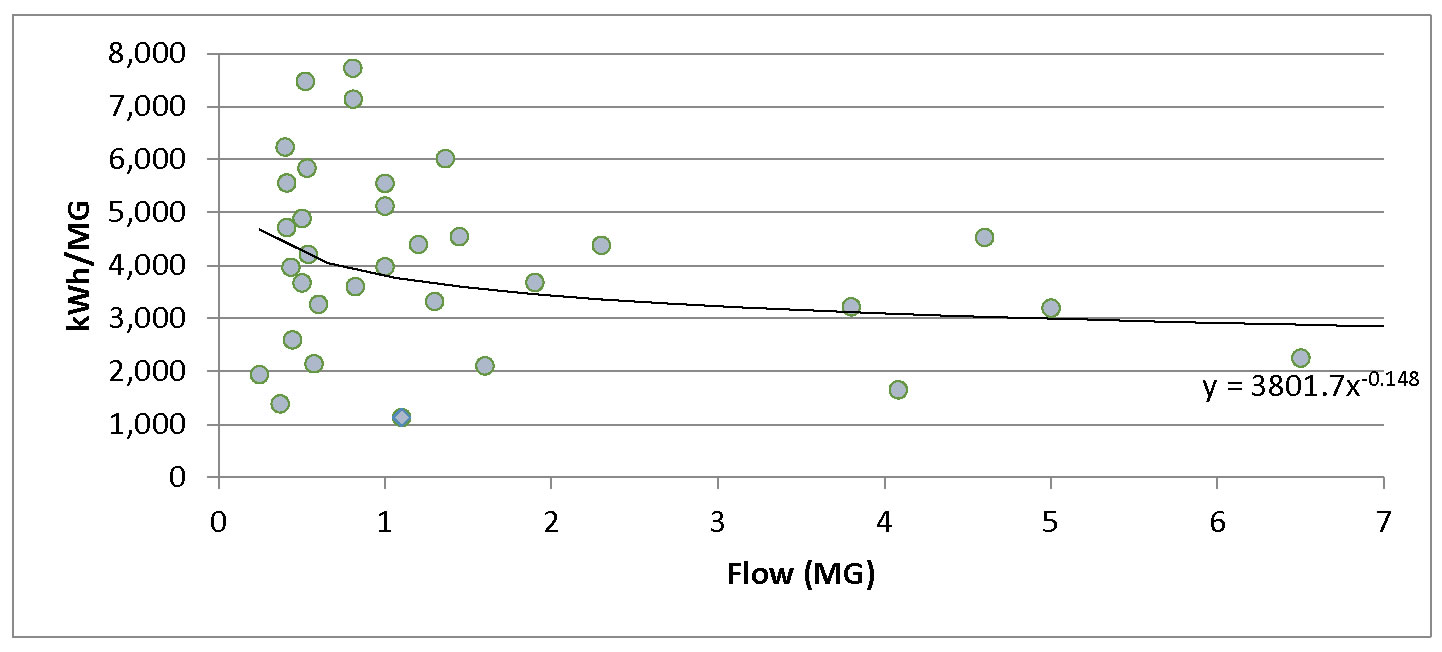
 or Hydraulic Benchmark – The simplest benchmark method takes the electricity2 consumed by a plant in a month or a year and divides it by the volume of water treated in that month or year. This method provides an overall energy use per volume treated and can be good to get a general idea of how energy/cost intensive your process may be. It is adequate for comparing smaller plants and those with largely residential loads. It is also a good measure for tracking energy performance within a single plant over time as long as the BOD load stays relatively steady. It will be somewhat more difficult for a small plant to achieve a very low hydraulic benchmark (economies of scale), but a very good score would be less than 1500 kWh/MG, while score higher than 5000 kWh/ MG suggests low energy efficiency. The chart at right shows the flow benchmarks for a number of Minnesota plants.
- BOD Benchmark –
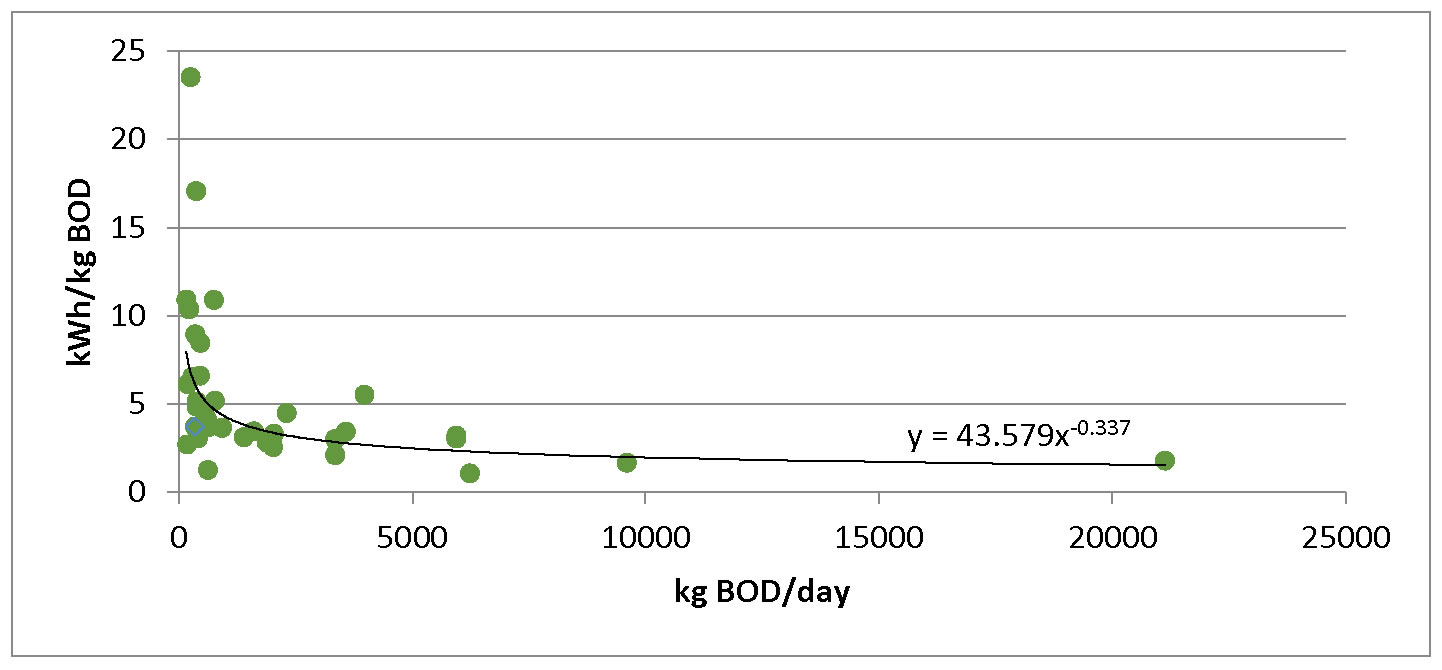
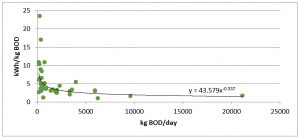 A second method takes the electricity2 consumed by a plant in a month or a year and divides it by the volume of BOD treated in that month or year (BODin – BODout). This accounts for differences in organic loading between plants. This is an important measure to use if BOD loads are high and more importantly when BOD loads vary over time. A very good score would be less than 1.5 kWh/kg BOD, while a score higher than 5 kWh/ kg BOD suggests low energy efficiency. The chart at right shows BOD benchmarks for a number of Minnesota plants – there is extreme variation among very small plants.
- A more sophisticated tool for benchmarking wastewater facilities is available through EnergyStar® Portfolio Manager3 (ESPM). To use the EnergyStar® tool you will need: electrical & gas bill information, influent flow, influent and effluent BOD. The ESPM benchmark accounts for climate and operations like nutrient removal and trickle filters. ESPM provides a percentile rank score compared to a large group of wastewater facilities nationally. An aggressive target would be the top 25% nationally (score = 75-100).The EnergyStar® benchmark is derived from statistical correlations and the most important factors affecting energy, in order of importance:
- Influent BOD
- Plant load factor (inflow/design flow)
- Presence of trickle filtration
- Heating degree days
- Effluent BOD
- Cooling degree days
- Presence of nutrient removal (for phosphorus limits or possibly other limits that have low energy inputs specify “no” nutrient removal; for nitrogen or ammonia limits that require additional aeration, specify “yes” for nutrient removal. EnergyStar® will give a misleading result if all nutrient removal is claimed within benchmark algorithm)
- Average influent flow
Heating and cooling degree days become less important for regional comparisons (within Minnesota or the upper Midwest), but can help explain some year to year variations. A weakness of ESPM is that it treats operational inputs as permanent and etched in stone, which is practical in the short run but has the effect of removing some options from the table before they are evaluated.
For example:
- For plants that treat to a very low effluent BOD, can you adjust plant operations to increase effluent BOD without violating limits?
- Can you work with industrial customers to reduce influent loads?
- Does it make sense to add a well-designed trickle filter during an upgrade to add more passive aeration?
All of these could reduce energy consumption but none would not improve your ESPM score.
- Advanced Process Benchmarking applies hydraulic or BOD benchmarks to key sections of your plant. An up-to-date motor inventory, with run hours and either amperage or kW measurements, greatly simplifies the process. This can be done on a few key pieces of equipment (e.g. aeration blowers), or it can be done on sections of the plant – we suggest these plant sections:
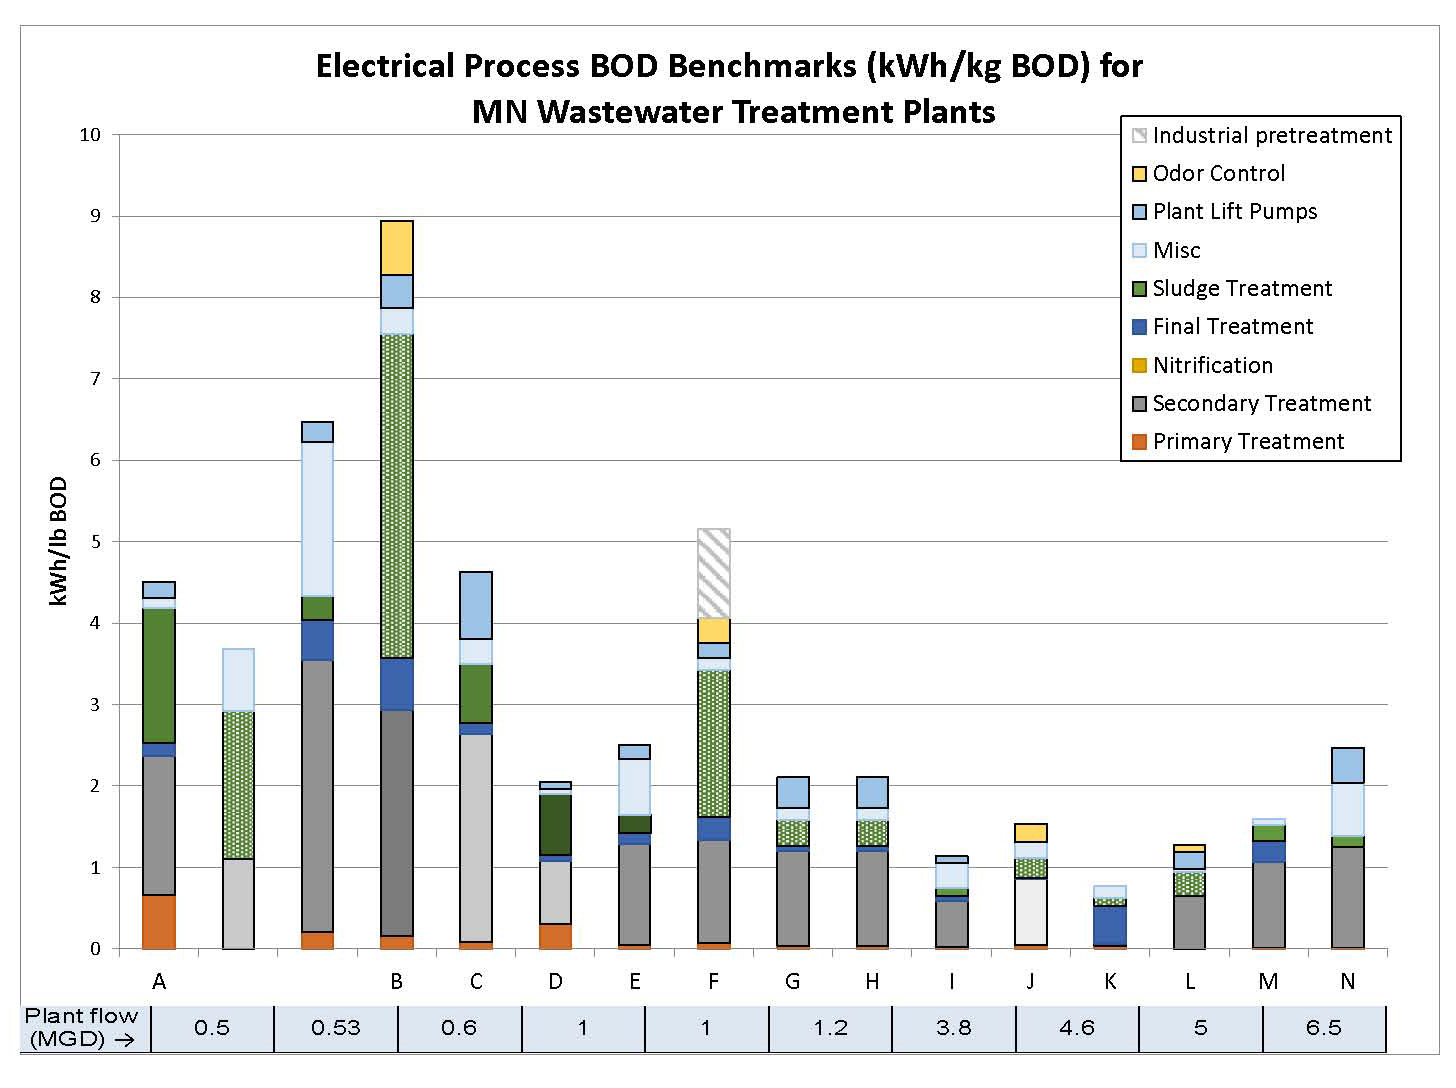
- Primary treatment
- Secondary treatment
(including RAS pumps) - Final treatment
- Biosolids treatment
(including WAS pumps) - Any internal lift pumps
- Any odor control
This is a powerful way evaluate the magnitude of energy consumption by plant section, which will guide where to put your effort. It can also help identify anomalies like biosolids energy greatly exceeding secondary energy, or energy distribution that does not make sense, which will suggest an opportunity. Process benchmarking over time can identify best operating points as well as equipment malfunctions. There is limited available process benchmark information for comparison purposes to gauge whether a plant section is efficient compared to other plants–talk to MnTAP about the process benchmarking information we have. The chart above shows process (BOD) benchmarks for 14 plants.
Using Benchmarks
Energy benchmarks are tools to guide early decisions and set priorities – however whole-plant benchmarks will not tell you definitively whether energy conservation opportunities exist, or how easy or expensive it would be to achieve better energy performance. Any of them work well for purely internal purposes of tracking the performance of a plant over time, although the hydraulic benchmark is by far the easiest to calculate.
Benchmarking your plant’s energy footprint can help you:
- Identify the existence of energy conservation opportunities through comparisons with other plants.
Start with ESPM – it will suggest how your plants energy performance stacks up nationally. Identify similar plants with better scores to identify strategies they are using successfully that you might adopt. - Identify the existence of energy conservation opportunities within your plant.
Implement process benchmarking to locate high consuming individual pieces of equipment and sections of the plant. Then look for ways to optimize, improve or repair as needed and appropriate. - Monitor progress over time or evaluate specific changes.
Process benchmarks will be the most accurate and pick up smaller changes. Flow benchmarking can be programed into SCADA as amps/MG, kwh/MG, amps/scfm etc., and thus is the most powerful measure for monitoring within a plant. - Evaluate the performance of large capital projects beforehand.
Explore your options and predict your operating costs related to new construction projects or major renovations. Process benchmarks for individual pumps and blowers or other key equipment work the best for this. Ask your design engineers how a new system will save energy and keep operating costs low. Then ask what level of consumption should be expected under different operating conditions such as current load, full design load, and intermediate points where additional equipment will need to start to carry the load. Use this information to judge whether spending a few more capital dollars now will save significant operation dollars over the life of the plant. Be skeptical of linear energy consumption estimates (i.e. half the energy at half capacity) that is a goal but few single pieces of equipment function that way, so it generally takes a well-designed system to get close.
Individual equipment benchmarks can also be used to evaluate how current equipment will impact energy costs as loads change. Look at what equipment needs to operate as loads increase. Pay special attentions to points just before and just after an additional piece of equipment starts – Is there a big jump-in cost, and if so does it make sense to add a smaller unit to bridge an inefficient operating point?
1. http://www.epa.gov/statelocalclimate/documents/pdf/background_paper_wastewater_1-15-2009.pdf
2. Using electricity as a surrogate for total energy can be a reasonable simplification because 80-90% of energy consumed by wastewater plants is electrical and because electricity is a more expensive form of energy, so a reduction in an energy unit of electricity will result in greater dollar savings than a reduction of the equivalent unit of gas or fuel energy.
3. http://www.energystar.gov/buildings/facility-owners-and-managers/existing-buildings/use-portfolio-manager